Chapter 2: Why Switch? Evaluating the Value of Switch Candidates
16
the remaining prescription patients (who have
low generic co-pays) to OTC consumers. It also
is more difficult to switch Rx volume to OTC
when the switch is a “partial” switch, and some
indications remain available by prescription, such
as was the case with Flonase. Taking a deeper
look at the allergy category, the trends to source
OTC volume from existing and new OTC users
have intensified. Table 2-4 provides data on the
source of volume for many recent allergy Rx-to-
OTC switches.
Nonetheless, there were enough new
sufferers in the allergy category that the intro-
duction of INS in 2013 brought enough new
users to the OTC market to prevent sales of
non-sedating antihistamines from declining
(although behind-the-counter combination
products of non-sedating antihistamines with
the decongestant pseudoephedrine did decline
slightly). One thing that the INS brands did
well was to encourage use before the start of the
allergy season as a preventative measure, thus
getting allergy sufferers to treat for more days in
the allergy season. Table 2-5 demonstrates that
the launch of INS brands did not steal category
share from NSAs, but rather grew the overall
allergy category.
With four OTC allergy brands in the US
exceeding $200 million in sales, another new
product in the OTC allergy category would
need to either bring significant prescription sales
volume, create a reason for existing OTC users to
switch brands, or convince non-treaters to begin
treating. In August 2018, Perrigo announced a
deal with Merck and Co., Inc. to switch Nasonex
(mometasone) to OTC.8 Once a blockbuster pre-
scription drug with sales in excess of $1 billion,9
generic versions of Nasonex have been available
since 2016.10 It will be interesting to see what
happens to Nasonex based on the order of entry
theory above. Unless Nasonex can secure a differ-
entiating claim, such as allergy prevention, it may
be hard for this brand to be successful in spite of
its latent equity.
While the allergy category is large and grow-
ing in size, thus providing favorable dynamics for
multiple successful switches, other categories are
smaller and declining, creating obstacles for com-
panies considering new switches. One of these
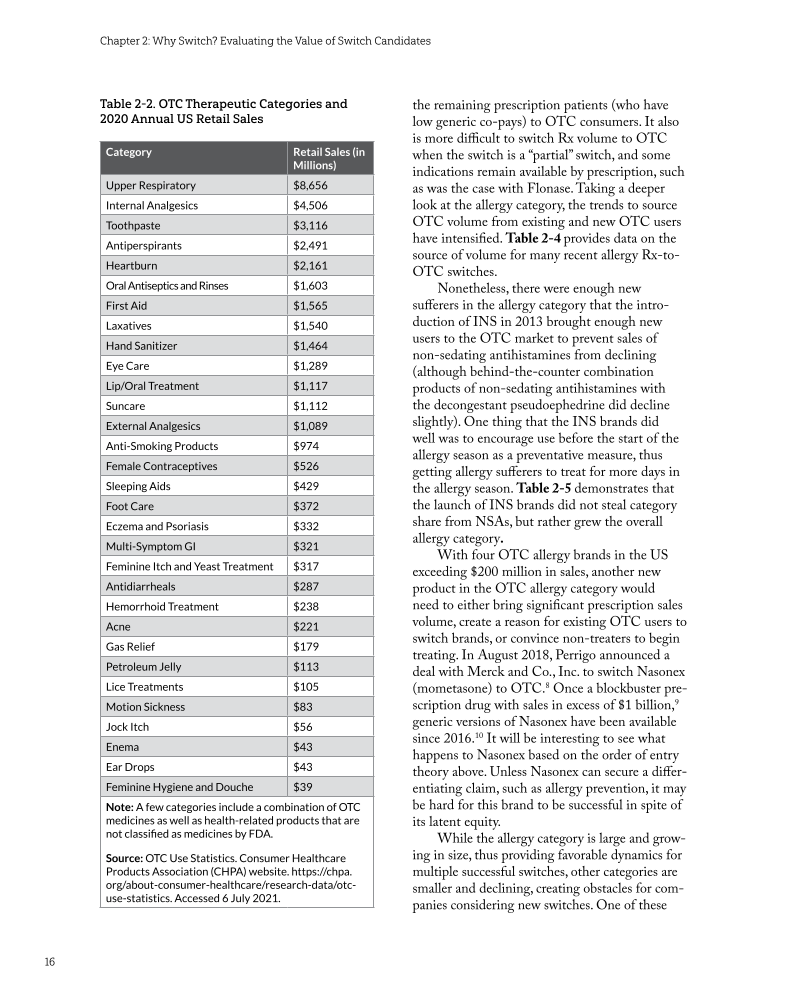
Table 2-2. OTC Therapeutic Categories and
2020 Annual US Retail Sales
Category Retail Sales (in
Millions)
Upper Respiratory $8,656
Internal Analgesics $4,506
Toothpaste $3,116
Antiperspirants $2,491
Heartburn $2,161
Oral Antiseptics and Rinses $1,603
First Aid $1,565
Laxatives $1,540
Hand Sanitizer $1,464
Eye Care $1,289
Lip/Oral Treatment $1,117
Suncare $1,112
External Analgesics $1,089
Anti-Smoking Products $974
Female Contraceptives $526
Sleeping Aids $429
Foot Care $372
Eczema and Psoriasis $332
Multi-Symptom GI $321
Feminine Itch and Yeast Treatment $317
Antidiarrheals $287
Hemorrhoid Treatment $238
Acne $221
Gas Relief $179
Petroleum Jelly $113
Lice Treatments $105
Motion Sickness $83
Jock Itch $56
Enema $43
Ear Drops $43
Feminine Hygiene and Douche $39
Note: A few categories include a combination of OTC
medicines as well as health-related products that are
not classified as medicines by FDA.
Source: OTC Use Statistics. Consumer Healthcare
Products Association (CHPA) website. https://chpa.
org/about-consumer-healthcare/research-data/otc-
use-statistics. Accessed 6 July 2021.
16
the remaining prescription patients (who have
low generic co-pays) to OTC consumers. It also
is more difficult to switch Rx volume to OTC
when the switch is a “partial” switch, and some
indications remain available by prescription, such
as was the case with Flonase. Taking a deeper
look at the allergy category, the trends to source
OTC volume from existing and new OTC users
have intensified. Table 2-4 provides data on the
source of volume for many recent allergy Rx-to-
OTC switches.
Nonetheless, there were enough new
sufferers in the allergy category that the intro-
duction of INS in 2013 brought enough new
users to the OTC market to prevent sales of
non-sedating antihistamines from declining
(although behind-the-counter combination
products of non-sedating antihistamines with
the decongestant pseudoephedrine did decline
slightly). One thing that the INS brands did
well was to encourage use before the start of the
allergy season as a preventative measure, thus
getting allergy sufferers to treat for more days in
the allergy season. Table 2-5 demonstrates that
the launch of INS brands did not steal category
share from NSAs, but rather grew the overall
allergy category.
With four OTC allergy brands in the US
exceeding $200 million in sales, another new
product in the OTC allergy category would
need to either bring significant prescription sales
volume, create a reason for existing OTC users to
switch brands, or convince non-treaters to begin
treating. In August 2018, Perrigo announced a
deal with Merck and Co., Inc. to switch Nasonex
(mometasone) to OTC.8 Once a blockbuster pre-
scription drug with sales in excess of $1 billion,9
generic versions of Nasonex have been available
since 2016.10 It will be interesting to see what
happens to Nasonex based on the order of entry
theory above. Unless Nasonex can secure a differ-
entiating claim, such as allergy prevention, it may
be hard for this brand to be successful in spite of
its latent equity.
While the allergy category is large and grow-
ing in size, thus providing favorable dynamics for
multiple successful switches, other categories are
smaller and declining, creating obstacles for com-
panies considering new switches. One of these
Table 2-2. OTC Therapeutic Categories and
2020 Annual US Retail Sales
Category Retail Sales (in
Millions)
Upper Respiratory $8,656
Internal Analgesics $4,506
Toothpaste $3,116
Antiperspirants $2,491
Heartburn $2,161
Oral Antiseptics and Rinses $1,603
First Aid $1,565
Laxatives $1,540
Hand Sanitizer $1,464
Eye Care $1,289
Lip/Oral Treatment $1,117
Suncare $1,112
External Analgesics $1,089
Anti-Smoking Products $974
Female Contraceptives $526
Sleeping Aids $429
Foot Care $372
Eczema and Psoriasis $332
Multi-Symptom GI $321
Feminine Itch and Yeast Treatment $317
Antidiarrheals $287
Hemorrhoid Treatment $238
Acne $221
Gas Relief $179
Petroleum Jelly $113
Lice Treatments $105
Motion Sickness $83
Jock Itch $56
Enema $43
Ear Drops $43
Feminine Hygiene and Douche $39
Note: A few categories include a combination of OTC
medicines as well as health-related products that are
not classified as medicines by FDA.
Source: OTC Use Statistics. Consumer Healthcare
Products Association (CHPA) website. https://chpa.
org/about-consumer-healthcare/research-data/otc-
use-statistics. Accessed 6 July 2021.